
 Wondering how your Facebook page’s performance compares against other pages? The social media analytics firm Quintly just released some interesting benchmark data that you can use for comparison purposes. Take a look at the infographic below. Some of the information is complicated, but it’s helpful and worth your trouble.
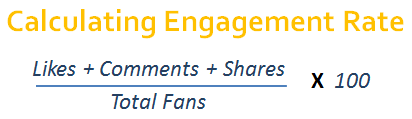
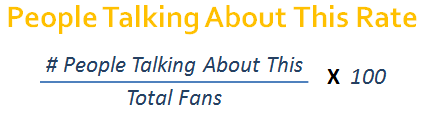 To do comparisons with your own page, you’ll need to do a couple of quick calculations for your own engagement rate and People Talking About This rate. These are both percentages, and you can use the formulas shown here to do your calculations.
A couple of notes/observations before you start:
- The Quintly data pretty much backs up the general rule of thumb that you’re doing fairly well if your engagement rate is in the 1-2% range. I’m not in love with that benchmark, mostly because I think different kinds of brands (retailers vs. publishers vs. non-profits and associations, for example) are likely to have audiences that engage differently and to differing degrees. But it does seem to hold up in most data analyses that I’ve seen. (SocialBakers has published some industry breakdowns, but they’re all focused on companies selling products or services; there’s not much there for associations, non-profits or publishers.)
- Your engagement rate and People Talking About This rate are not the be-all and end-all metrics that you should use to measure the effectiveness of your organization’s social media efforts. You need to define your own organizational KPIs, depending on what you are trying to achieve through social media (for example, inbound traffic to your web site from social media sites if you are trying to build your website audience; or number of shares of your social media posts, if you’re specifically trying to increase brand awareness among people who don’t yet know you). What these broader engagement metrics can do, though, is help you see how well your social media content is engaging your audience.
